
Our Products
Highlights
The AV Sales Index (AVI-S) for June jumped from 53.1 to 60.4. 37% of Non-north American respondents reported increase in sales for June while only 19% did so in May. This accounts for the large increase in the overall AVI-S. Live events and data centers remain strong, keeping the industry remain in a growth phase even with the uncertain economy.
The strongest negative factor affecting sales has been ongoing tariff pressure on AV hardware and components .The industry is reporting higher costs for displays, cameras, lighting, and computing products, causing some organizations to delay purchases or reconsider project scope.
The June AV Employment Index (AVI-E) dropped two points to 51.4. Some respondents say they are under budget constraints which restrict new hiring or even loss of staff that positions will not be refilled. The U.S. added only 57,000 nonfarm jobs in June, below expectations and down from a revised 129,000 in May. Job gains continued in professional and business services, social assistance, and health care, while leisure and hospitality lost jobs
International Outlook
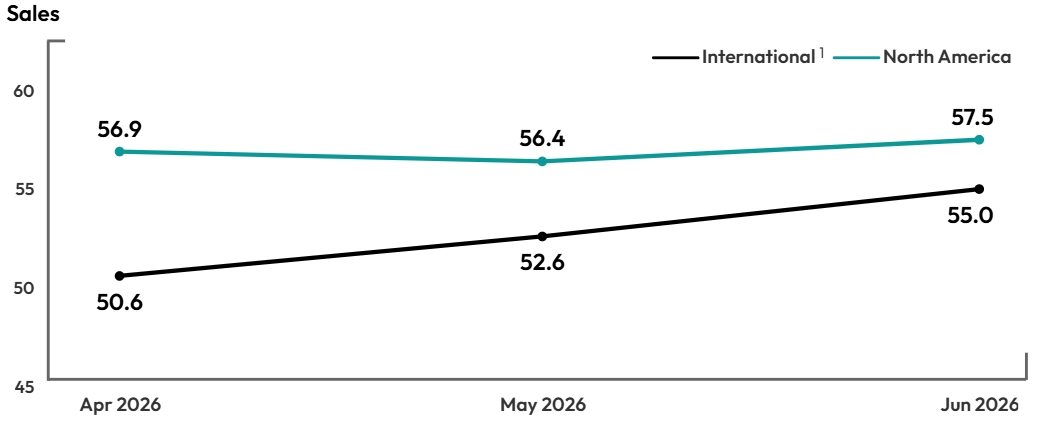
The preliminary North American AV Sales Index (AVI-S) rose one point to 57.5 in June, while the non-North American Sales index increase over two points to 55. Non-North American pro AV sales growth in June likely reflects continued project conversion and resilient demand rather than a clear easing of global uncertainty. Some firms may be benefiting from delayed projects moving forward, customers purchasing ahead of further price increases, and higher nominal billings caused by rising input costs. However, the growth should be interpreted cautiously: elevated tariffs, fuel costs, currency pressure, and export uncertainty may still be weighing down margins and making demand more fragmented and risk sensitive.
On the employment side, the preliminary North American AVI‑E remained steady at 54.3. The non‑North America AVI‑E dropped one point to 48.5 showing contraction for June
1Due to the small sample, the North American and International indexes are based on a 3-month moving average. The June 2026 index is preliminary, based on the average of June 2026 and May 2026 and will be final with July 2026 data in the next report.
Methodology
The survey behind the AVIXA Pro AV Business Index was fielded to 2,000 members of the AVIXA Insights Community between June 28, 2026 and July 72026. A total of 275 AV professionals completed the survey. Only respondents who are service providers and said they were “moderately” to “extremely” familiar with their company’s business conditions were factored in index calculations. The AV Sales and AV Employment Indexes are computed as diffusion indexes. The monthly score is calculated as the percentage of firms reporting a significant increase plus half the percentage of firms reporting no change. Comparisons are always made to the previous month. Diffusion indexes, typically centered at a score of 50, are used frequently to measure change in economic activity. If an equal share of firms reports an increase as reports a decrease, the score for that month will be 50. A score higher than 50 indicates that firms, in the aggregate, are reporting an increase in activity that month compared to the previous month. In contrast, a score lower than 50 is a decrease in activity.
Want to get the newest report earlier than everyone else?
Join AVIXA’s AV Intelligence Panel. Panel members get early access to the business index each month, along with other perks, in exchange for their insights. Learn more and see if you qualify to join.
About the AVIXA Insights Community
The AVIXA AV Intelligence Panel (AVIP) is now part of AVIXA’s Insights Community, a research group of industry volunteers willing to share their insights on a regular basis to create actionable information. Members of the community are asked to participate in a short, two-to-three-minute monthly survey designed to gauge business sentiment and trends in the AV industry. Community members will also have the opportunity to participate in discussions, polls and surveys.
Community members will be eligible to:
Earn points toward online gift cards
Receive free copies of selected market research
Engage directly with AVIXA's market intelligence team to help guide research
Ask and answer other industry professionals' questions
The Insights Community is designed to be a global group, representative of the entire commercial AV value chain. AVIXA invites AV integrators, consultants, manufacturers, distributors, resellers, live events professionals, and AV technology managers to get involved. If you would like to join the community, enjoy benefits, and share your insights with the AV industry, please apply here.
Interested in learning more?
Market Intelligence Sales
Contact Us: [email protected]